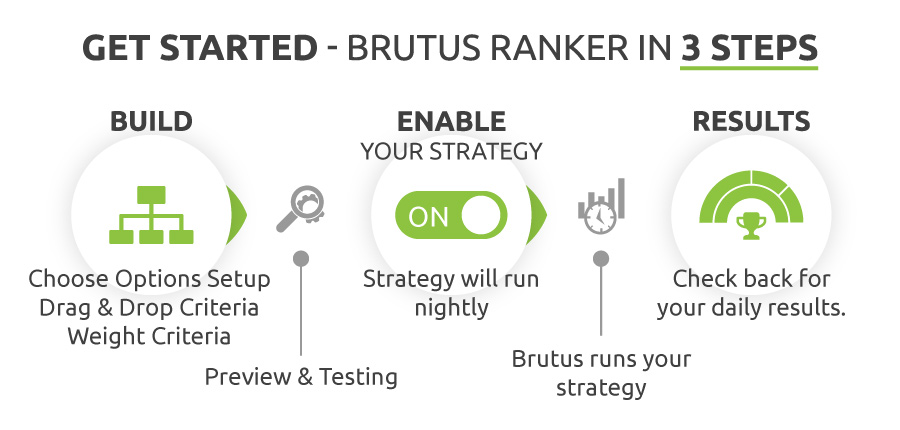
Step 1
The Brutus Options Ranker works on your strategies. You have a few options to get started. You can elect to clone an existing strategy or framework, follow strategies (coming soon), or build your custom strategy from scratch.
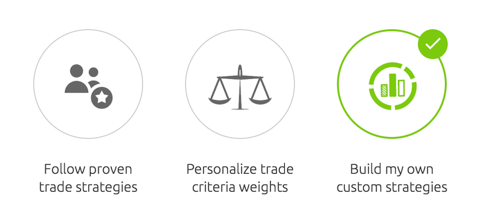
This guide focuses on building your strategy from scratch. You can build as many strategies as you like. Also, Freemium users can enable up to one strategy at a time. Strategies will be sent to Brutus each trading day right before the market close, however, only if they are enabled. This process forms the basis of the ranking job. With Premium accounts (available soon), you will be able to enable multiple strategies at a time.
Market Groups are selections of underlying assets (stocks/ETFs) upon which the ranking will be completed.
Brutus uses these Market Groups rather than the entire options market. This is because a pre-made list of stocks and ETFs is a simpler concept for beginners to understand. Furthermore, these curated groups provide an extra level of safety to ensure only high quality stocks and ETFs make it into the ranking algorithm.
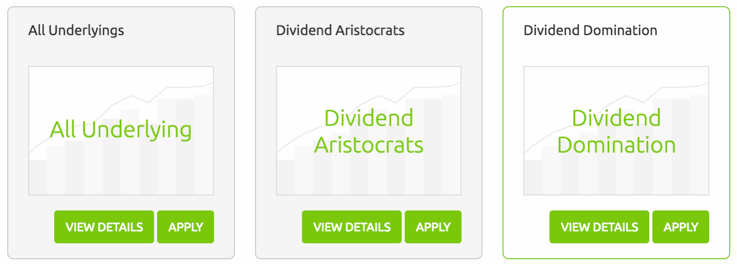
We are also releasing Dynamic Market Groups and Custom Market Groups soon. The Market Groups will be populated based on daily market conditions or a static list of your favorite stocks for daily screening.
An Options Setup is the options spread that will be ranked.
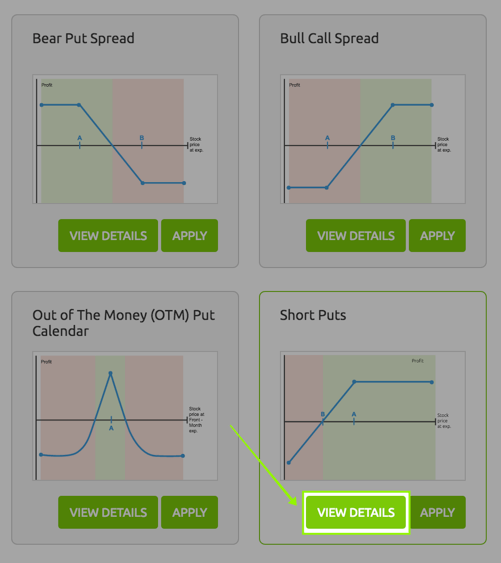
You might see these "Options Setups" called "Options Strategies" elsewhere, but please don't confuse this. For Brutus, an Options Setup is only part of your overall options strategy. Brutus needs a completed strategy to perform your ranking:
There are multiple setup types available today in beta and more spread types being added all the time.
If you are unfamiliar with any of the setup types you can click the "View Details" button for a full explanation.
Make sure the check the "What's New" panel in your dashboard for announcements on additional setups being made available.
Most setups will be free to run under OptionAutomator's freemium plan, others will be premium only.
The most important activity to build up your strategy is to add criteria to your Strategy Tree.
After you select your market group and your Options Setup Type, Brutus understands what goes into the funnel for ranking. This is an important concept, we call these the alternatives generated for the strategy. You will see a visual representation of what goes into the funnel at the bottom of the Strategy Builder page, shown in the image below.
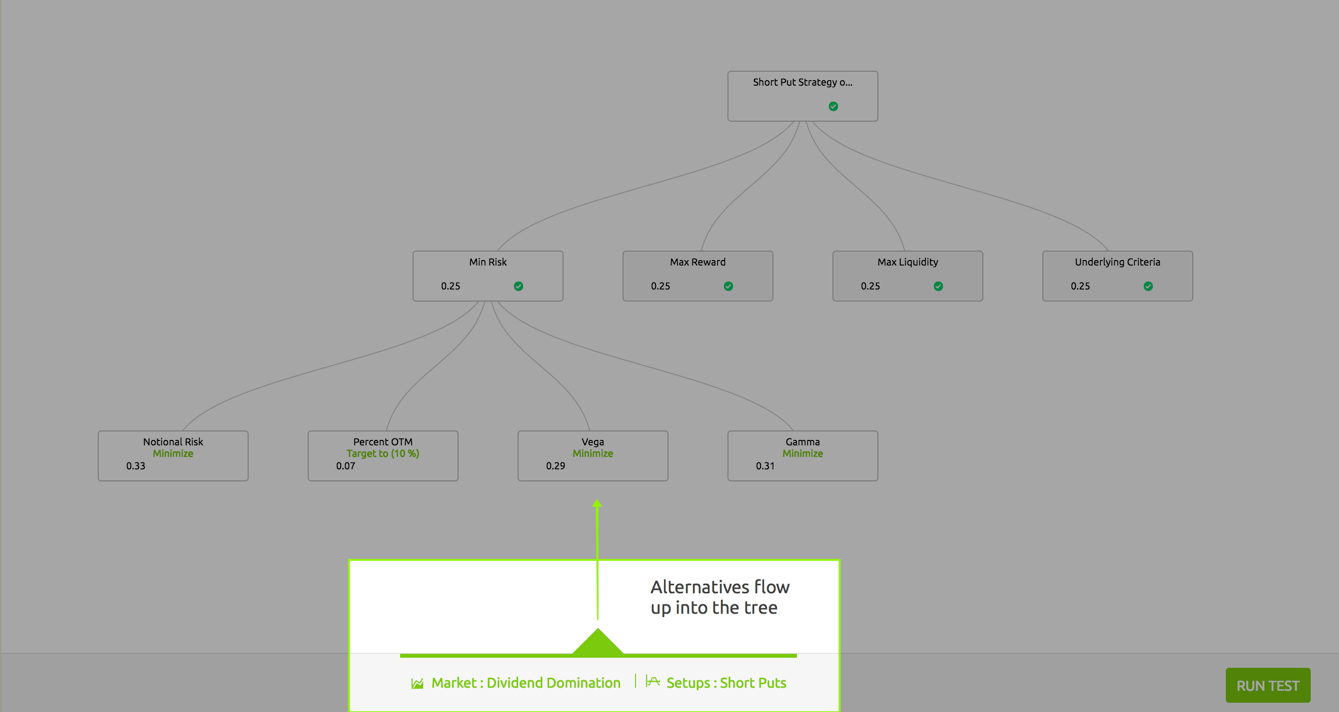
This visual representation of your strategy, is referred to the strategy tree. When building your strategy from scratch, you will be presented with a blank tree.
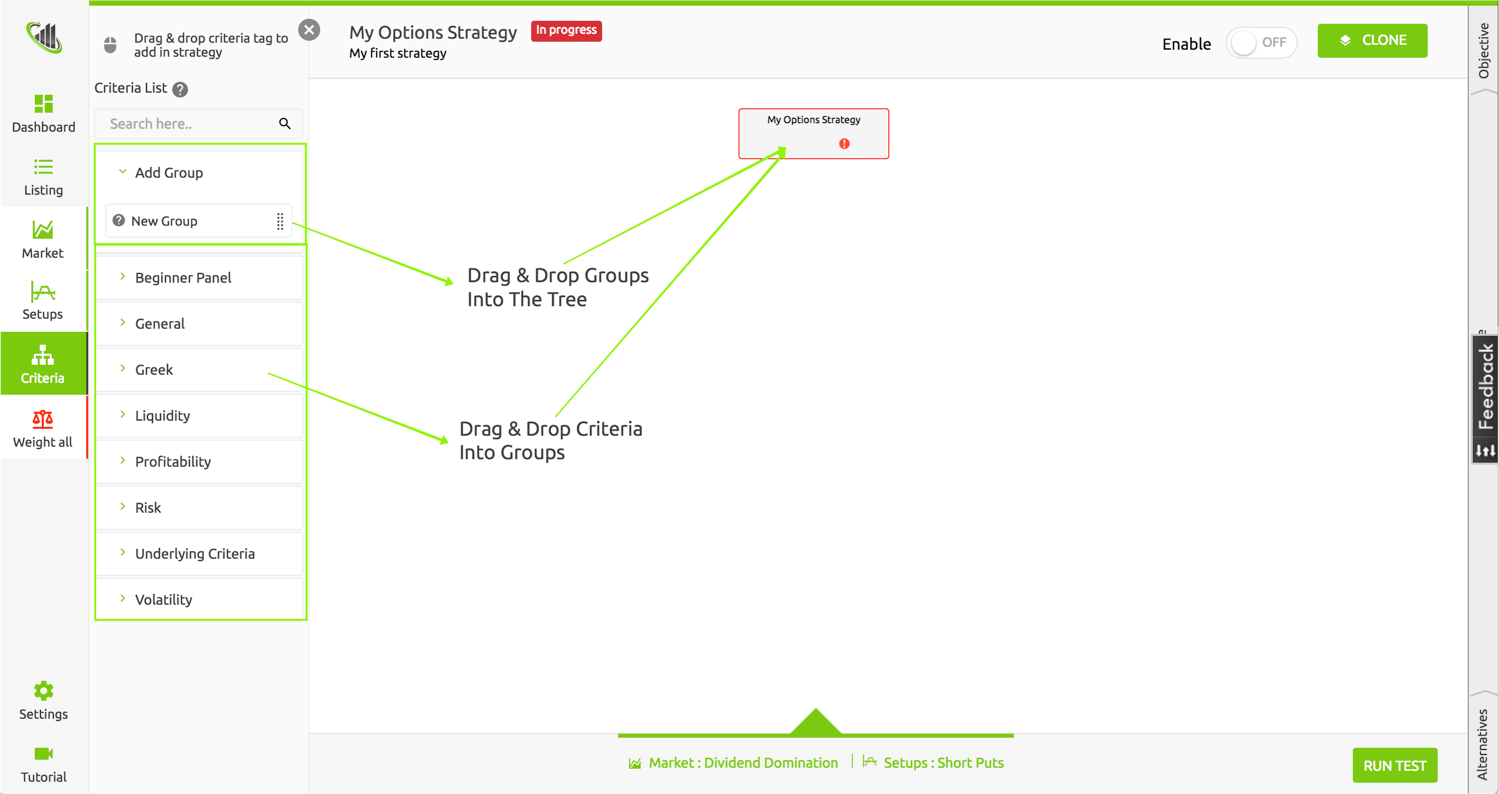
Simply drag and drop one of the two into your tree:
Groups - these are logical collection of criteria that are related. You can add any type of group and name it whatever you'd like. We recommend using a consistent groups across your strategies.
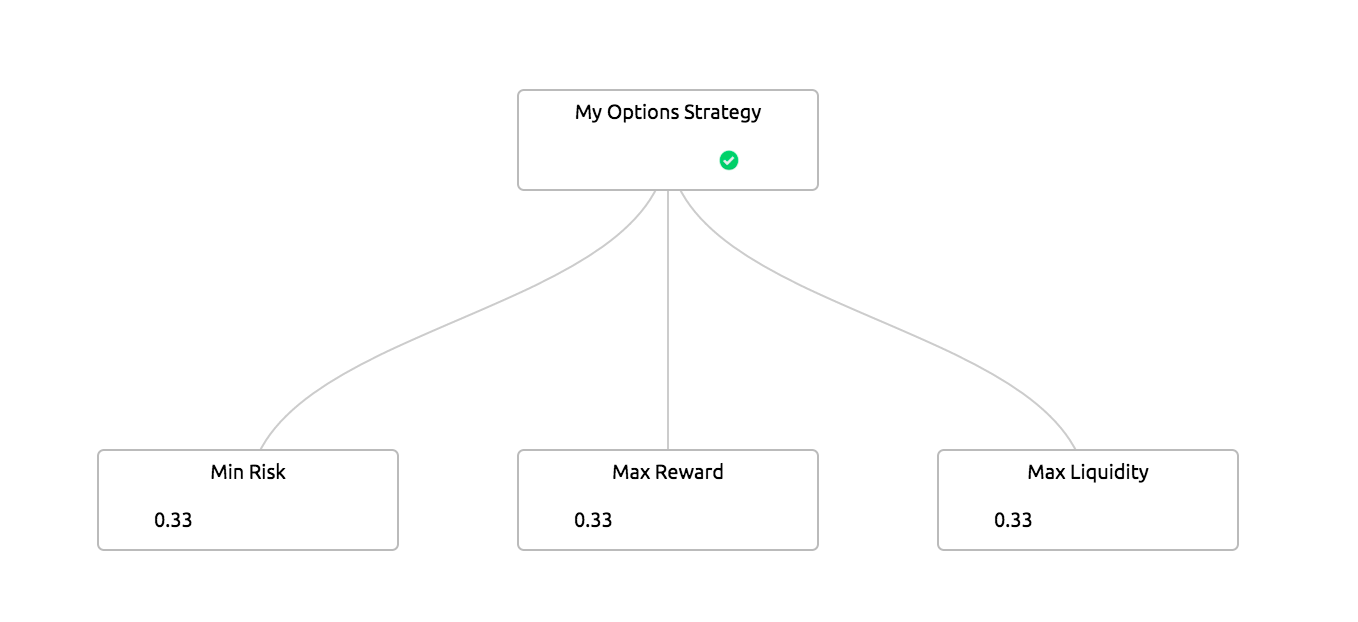
A good practice is to have a group for: Minimize Risk, Maximize Reward, and Maximize Liquidity. These can go at the root of your tree.
We have provided a framework template which you can clone to get this set of groups at the root of your tree.
Criteria - The criteria panel to the left of the tree has a multitude of sections with different criteria. You can go into the profitability criteria panel, for example, and add the setup's Return on Capital to your tree. If you are unfamiliar with a criteria you can click the help tip icon next to the criterion.
![]()
Once you add a criteria to the tree, you will be prompted to state your objective with regards to that specific criteria. You can either maximize, minimize, or target the criteria to a particular value. For our example, using the Return on Capital criterion, we want to maximize this criterion as much as possible.
Once you've added all the criteria you want evaluated, then it's time to move on to Weighting Your Criteria.

To weight your criteria, you can either hit the Weight All Button or weight an individual group in the tree by click the red icon, which indicates your criteria are not yet ranked.
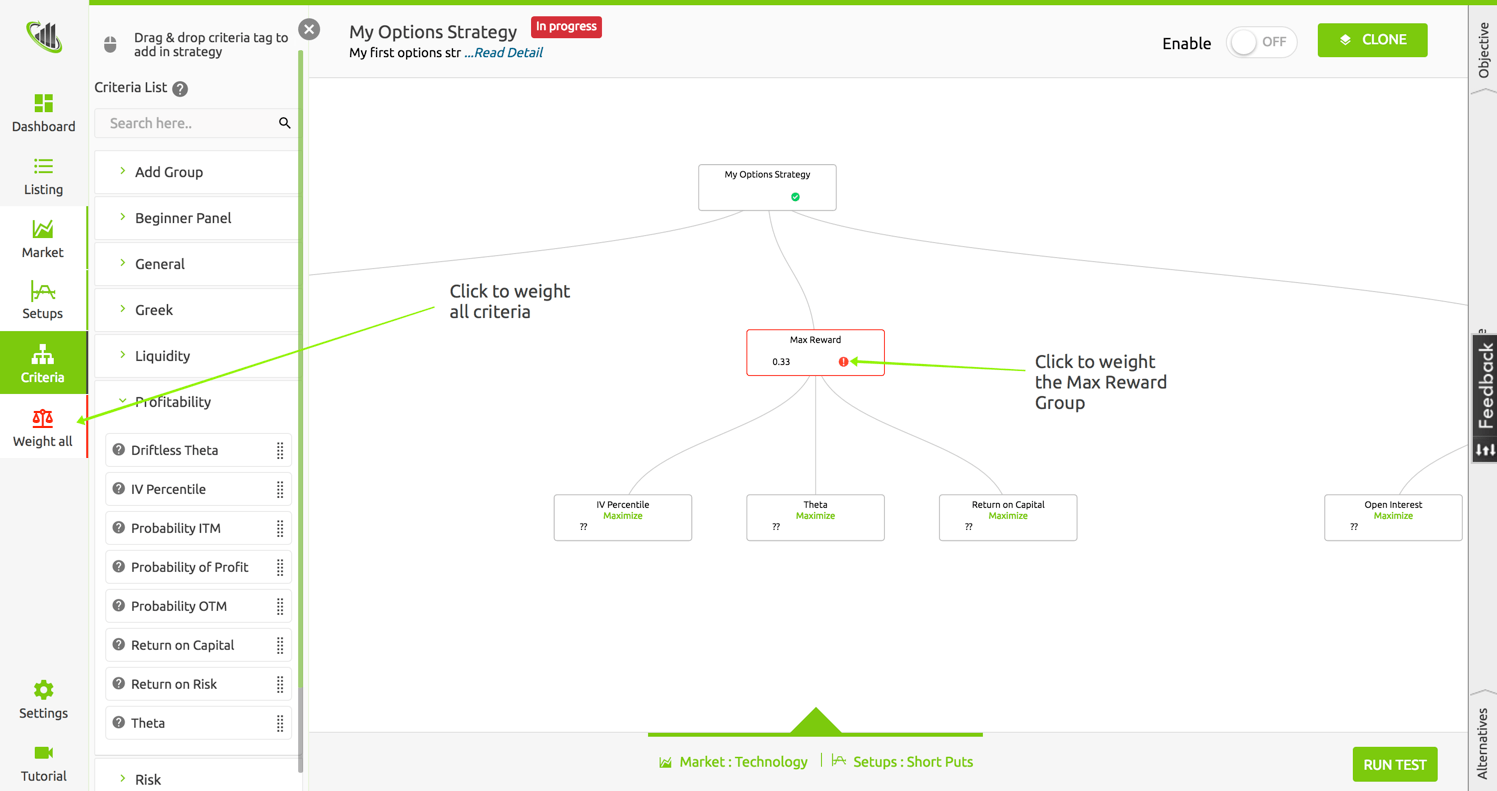
The screen that follows requires you do a pair-wise preferences of each criterion against each criteria in that group. The colors on the slider give a hint that you should yellow and red preference sparingly and stick mostly to the green region.
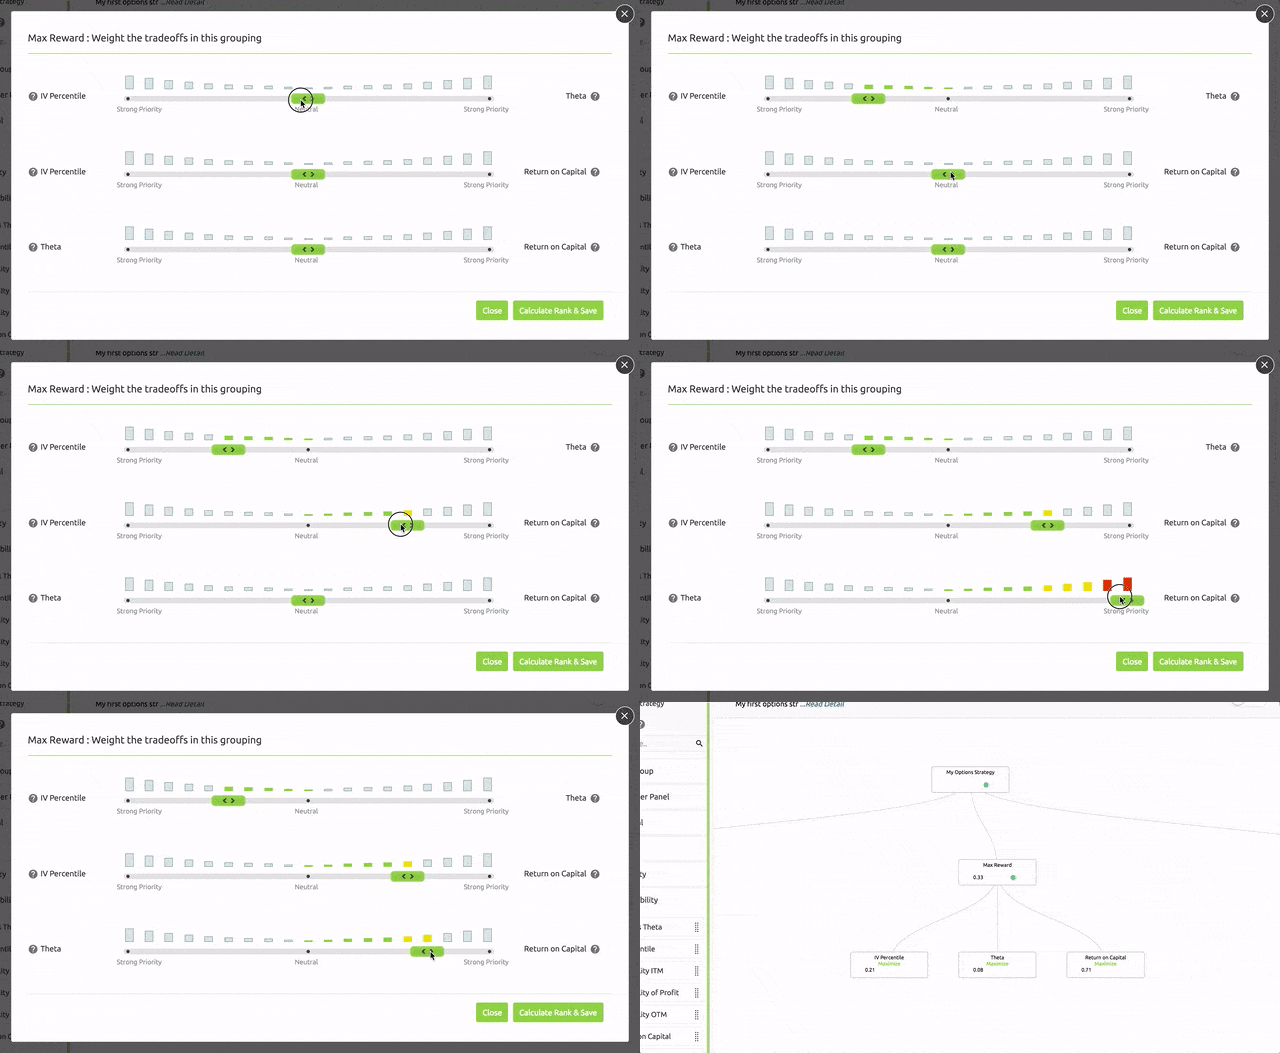
When you turn the preference all the way to one criterion vs. another, Brutus will understand that you have an "Extreme Preference" for the particular criteria. While Brutus is smart enough to decode your preference based on how you weight the others, he will essentially treat this particular criterion as a filter vs. trying to balance the tradeoffs betw
een the two criteria.
Don't stress about weighting preference between two dissimilar units. E.g., you could have a slight preference for a the number of Days to Expiration (DTE) to be close to 40 days as possible (units of days) vs. Maximizing Return on Capital (units of %). Brutus can translate all this with the AI framework that runs behind the scenes.
Once your weights are complete, you can optionally hit the "Run Test" button to get a preview of how Brutus will interpret your strategy by returning test results. This is called Sandbox Testing and Brutus performs the ranking on a scaled down market data from 2 weeks ago. As this is outdated information, it is intended to give you a preview of how your strategy will perform and not intended for trading.
Step 2
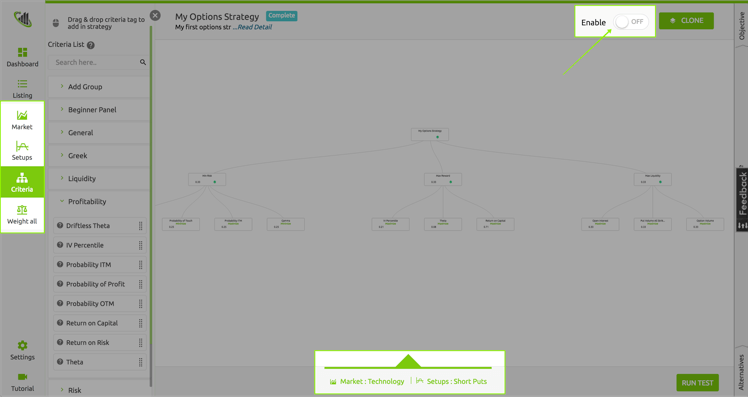
Always remember to fully complete your strategy. You must set the Market Group, Setup Type, and Criteria with their associated weightings. After you will notice that all the buttons that were once red on the screen have turned green. This means that you are ready to enable your strategy. Click the enable button directly in the build screen or in your strategy listing page.
 Step 3
New Strategy Results are available each day.
Brutus collects market data 15 min before, instead of after the close each market day. One of the key reasons is you get more representative bid-ask spreads just prior to close, than after the close.
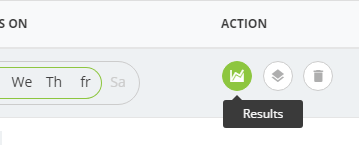
On your Strategy Listing page, there is a results icon in the Action column. Click this button to bring you to the results page for that particular strategy.
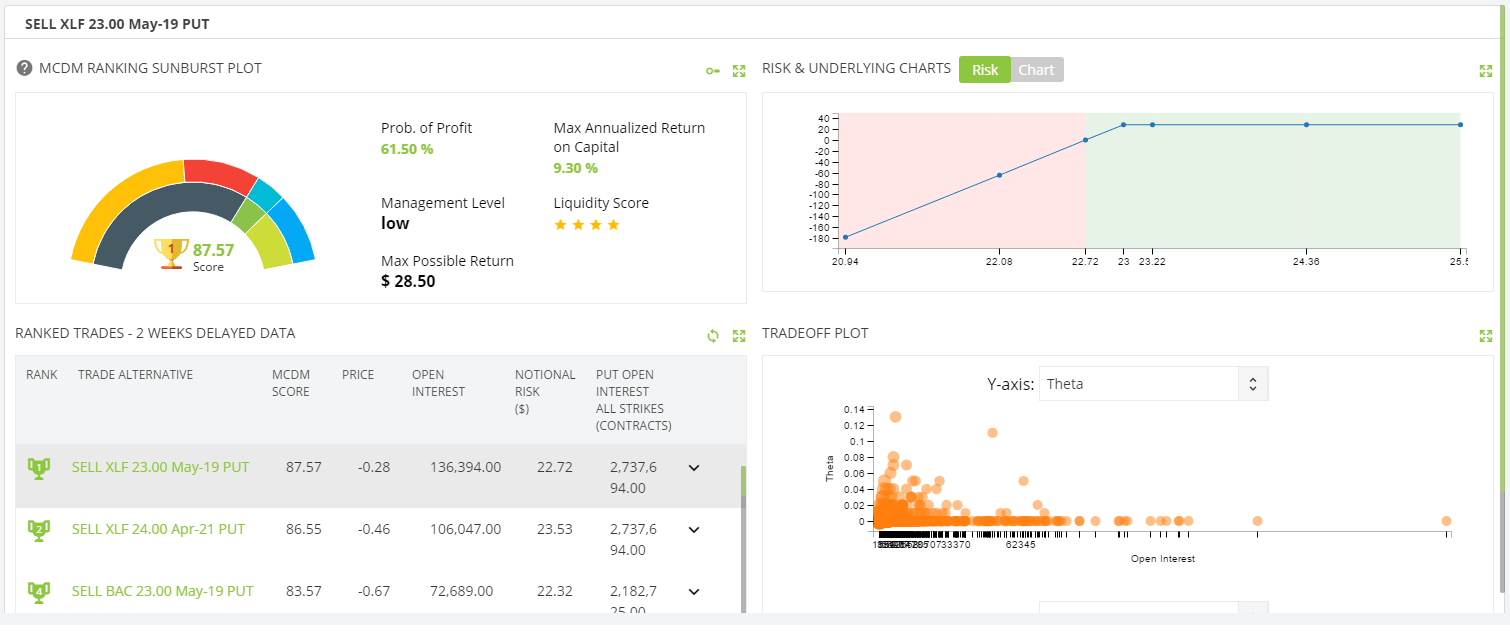
Here you can view all the Ranked Trades with their MCDM scores, which you will find in the bottom left quadrant. Also, the Risk Graph & Charts on the Underlying, which you can find in the top right quadrant. And finally, the Trade-off plot in the bottom right quadrant.
The top left quadrant shows additional information on the currently selected ranked trade (bottom left). If you change your selection in the Ranked Trades list, both top section's information will be updated to the selected item.

The sunburst plot provides an indication of the contribution for each of the selected specified criteria, as shown here. You can select the key to the top right to display a Legend to help identify those criteria.
Furthermore, the Risk graph shows you the profit & loss trade potential, while the Chart tab indicates the historical trend of the stock price.
Finally, the bottom right Trade-off Plot allows you to visualise two conflicting criteria. The idea behind this plot is to search for outliers which could potentially be interesting trades. You have the ability to change the comparison using the X-axis & Y-Axis drop-down boxes.
We hope this arms you with helpful information to build your own options trading strategy with the Brutus Options Ranker. We’re excited to see what the community comes up with and please don’t hesitate to reach out if you need help.